This page was generated on 2016.04.28 by Auto-Redistrict.
vtd_data.txt (tab-delimited)
vtd_data.dbf (dbase/ESRI)

Aiken County
Richland County
VTD district assignments
vtd_data.txt (tab-delimited)
vtd_data.dbf (dbase/ESRI)
Maps (click to enlarge)
 Labeled districts
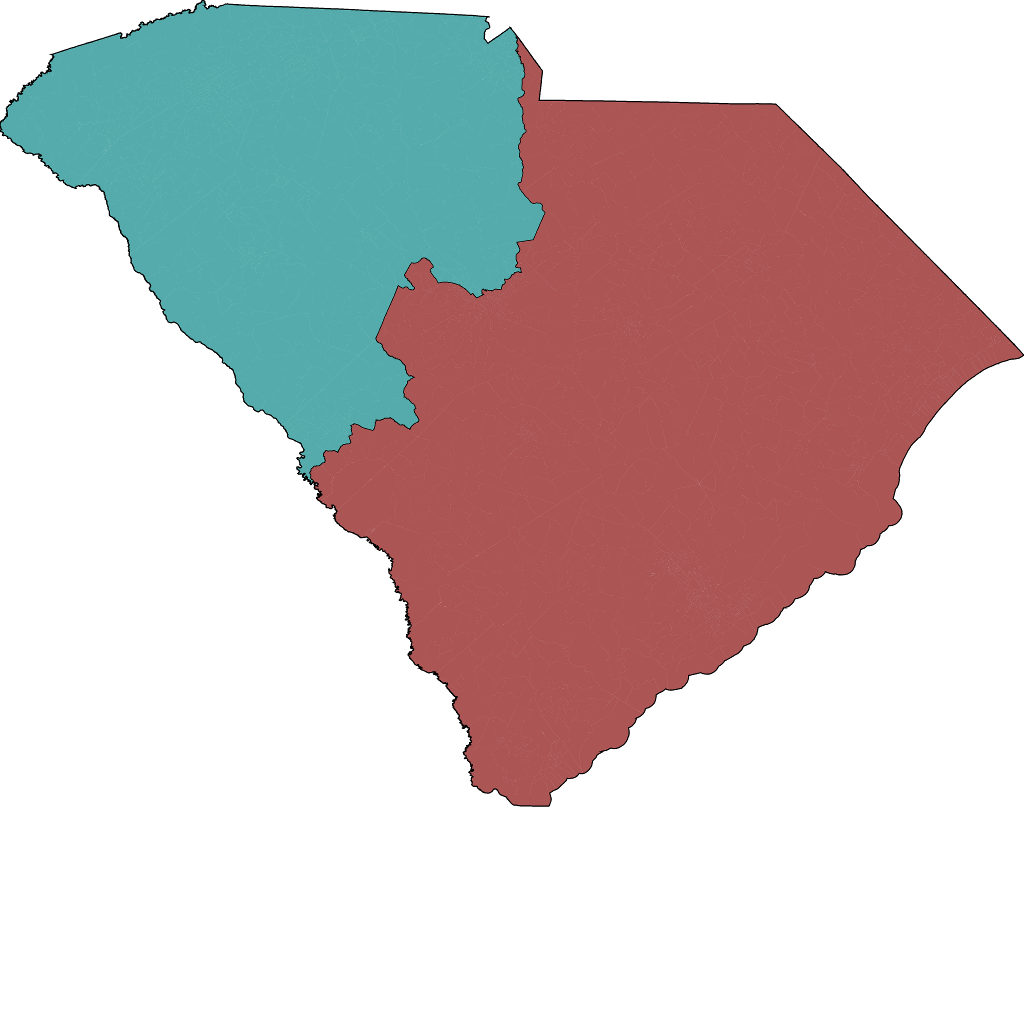 Unlabeled districts
 Population difference
 Compactness
 Splits
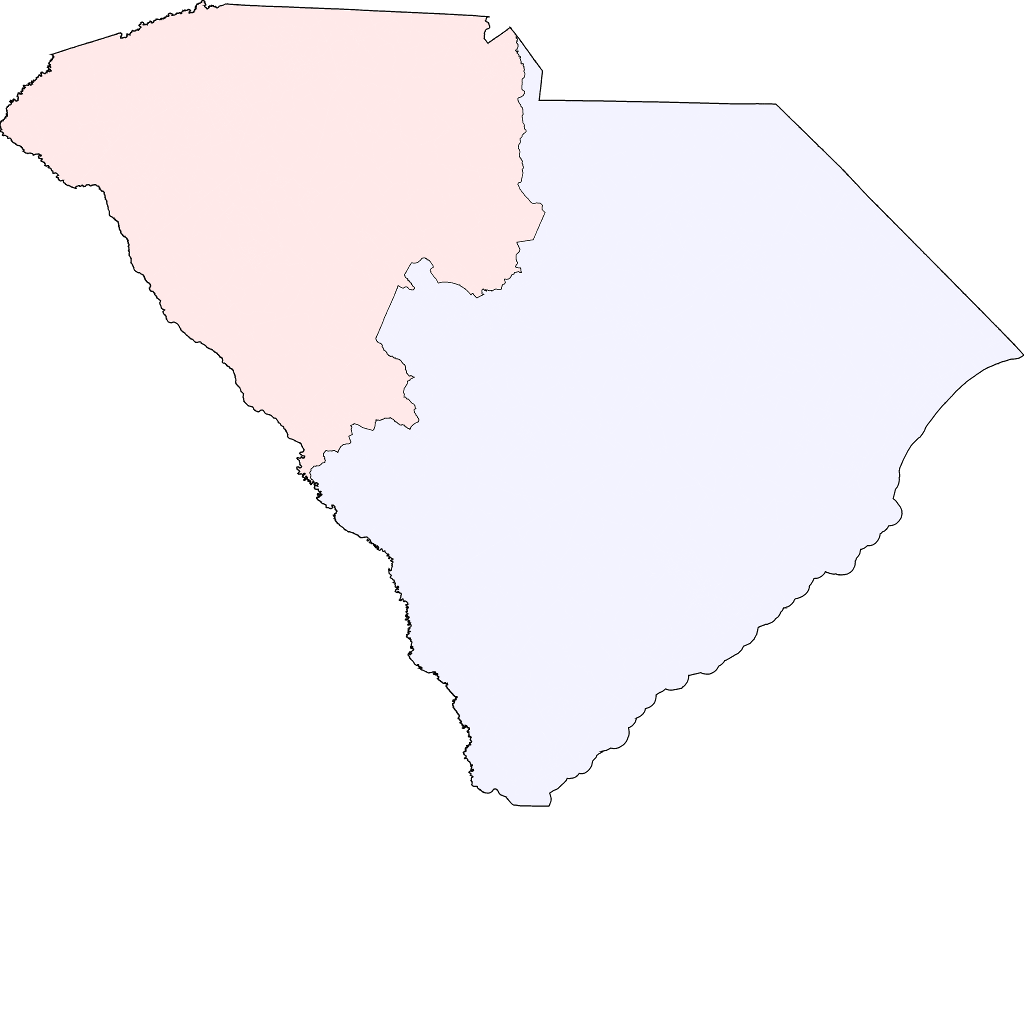 Partisan vote packing
 Racial vote packing
 District vote balance
 District demographics
 Partisan vote packing
 Racial vote packing
 District vote balance
 District demographics
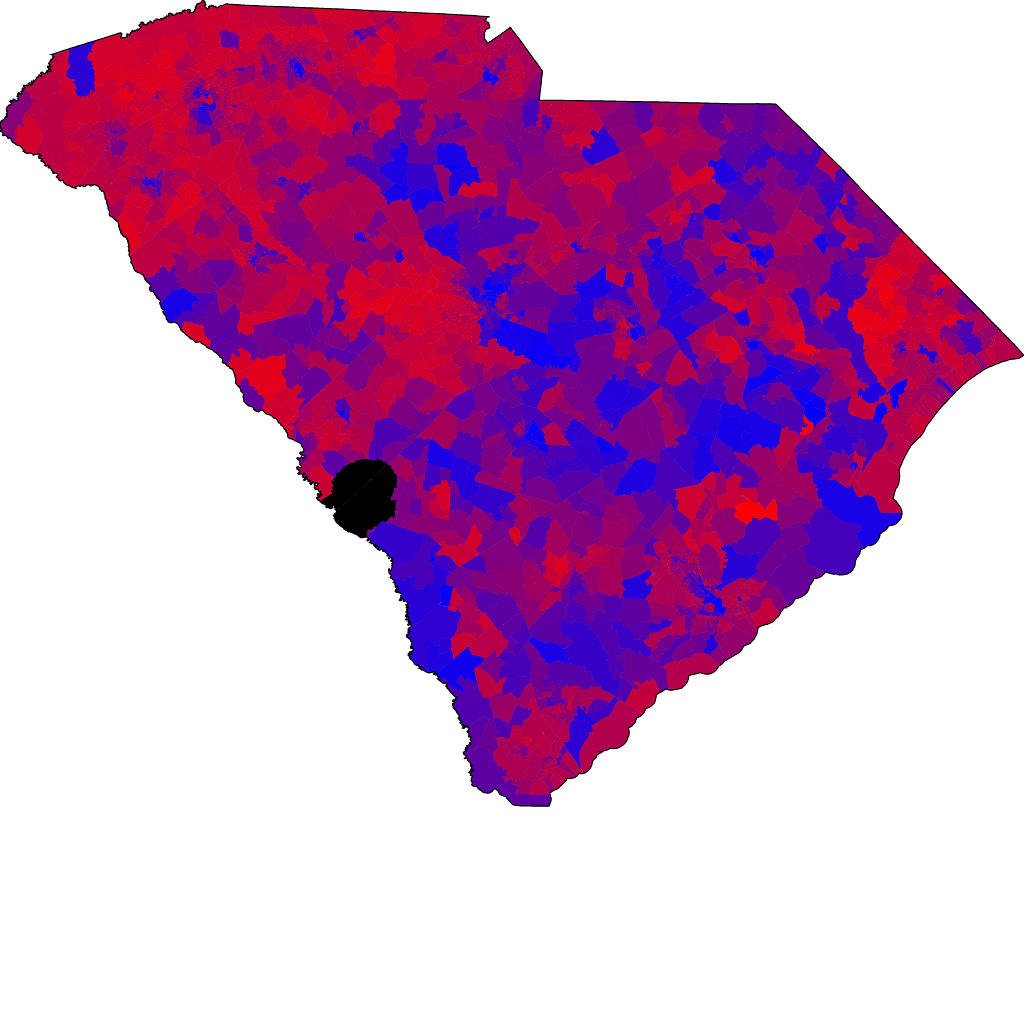 VTD vote balance
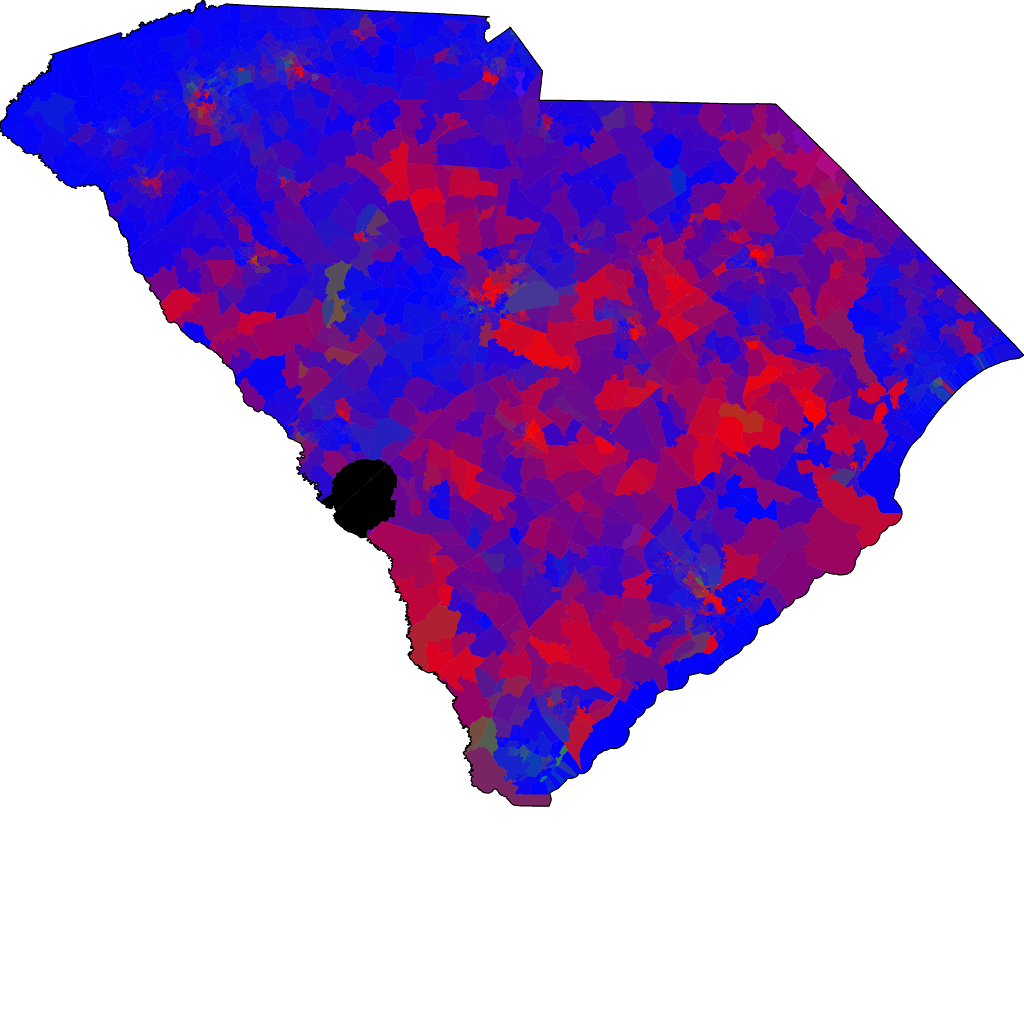 VTD demographics
 VTD vote balance
 VTD demographics
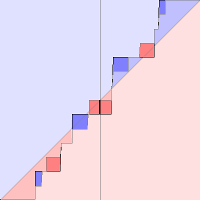
Seats / votes curve - Vote packing
Summary
| Value | Measure |
|---|---|
| 0.5239245642935393 | Compactness (isoperimetric quotient) |
| 0 | Disconnected population (count) |
| 0.004161909 | Population max deviation (%) |
| 0.002038450 | Population mean deviation (%) |
| 2 | County splits |
| 0.034022088 | Seats / vote asymmetry |
| 418,196 | Competitiveness (victory margin) |
| 4.358979592 | Representation imbalance (global) |
| 0.014758935 | Racial vote dilution |
| 35.873857937 | Efficiency gap (pct) |
| 0.717477159 | Adj. efficiency gap (seats) |
| 542,752 | Undescribed voters |
| 2.0 | FV Safe D |
| 1.0 | FV Lean D |
| 0.0 | FV Tossup |
| 0.0 | FV Lean R |
| 4.0 | FV Safe R |
| 0.673794700 | Mutation rate (%) |
| 33.000000000 | Elitism (%) |
| 0 | Generation (count) |
By party
| Party | Delegates | Pop. vote | Wasted votes | % del | % pop vote |
|---|---|---|---|---|---|
| PRES12_D50 | 3 | 801,921 | 133949 | 0.42857142857142855 | 0.42936928968255667 |
| PRES12_R50 | 4 | 1,065,751 | 131917 | 0.5714285714285714 | 0.5706307103174433 |
By district
| District | Population | Winner | PVI | Vote gap | Wasted votes | FV Safe D | FV Lean D | FV Tossup | FV Lean R | FV Safe R | Pop per seats | Compactness | Area | Paired edge length | Unpaired edge length | PRES12_D50 vote % | PRES12_R50 vote % | PRES12_D50 votes | PRES12_R50 votes | VAP_WHITE % | VAP_BLACK % | VAP_HISPAN % | VAP_ASIAN % | VAP_HAWAII % | VAP_INDIAN % | VAP_MULTI % | VAP_OTHER % | VAP_WHITE pop | VAP_BLACK pop | VAP_HISPAN pop | VAP_ASIAN pop | VAP_HAWAII pop | VAP_INDIAN pop | VAP_MULTI pop | VAP_OTHER pop |
|---|---|---|---|---|---|---|---|---|---|---|---|---|---|---|---|---|---|---|---|---|---|---|---|---|---|---|---|---|---|---|---|---|---|---|---|
| 1 | 2,643,018 | 2,2, | R+3 | 213432 | 136251 | 1.0 | 1.0 | 0.0 | 0.0 | 2.0 | 660,754 | 0.5592034749482074 | 4.400305740614546E12 | 3620682.4545950666 | 8431099.590248182 | 0.4729043385719135 | 0.5270956614280865 | 515,461 | 574,529 | 0.624819017 | 0.304619451 | 0.043472216 | 0.012413685 | 0.000544361 | 0.004129870 | 0.009098882 | 0.000902519 | 1,271,766 | 620,027 | 88,484 | 25,267 | 1,108 | 8,406 | 18,520 | 1,837 |
| 2 | 1,982,346 | 1,2, | R+13 | 204764 | 129615 | 1.0 | 0.0 | 0.0 | 0.0 | 2.0 | 660,782 | 0.49283283081054763 | 2.330430141773116E12 | 3620682.454595066 | 5450501.113802845 | 0.3683510740894093 | 0.6316489259105907 | 286,460 | 491,222 | 0.724755958 | 0.207267427 | 0.043519767 | 0.012871363 | 0.000300767 | 0.002787062 | 0.007843124 | 0.000654532 | 1,094,001 | 312,865 | 65,692 | 19,429 | 454 | 4,207 | 11,839 | 988 |
By ethnicity
| Ethnicity | Population | Vote dilution | % Wasted votes | Victory margins | Votes | Straight vote descr. rep. | Target seats | Votes for next seat |
|---|---|---|---|---|---|---|---|---|
| VAP_WHITE | 2,365,767 | 1.010983741 | 0.226372380 | 281,760.301514461 | 1,244,676.143697378 | 6 | 5 | 57,568 |
| VAP_BLACK | 932,892 | 0.972998703 | 0.217867037 | 107,456.446188387 | 493,220.302960345 | 1 | 2 | 130,246 |
| VAP_HISPAN | 154,176 | 1.000080081 | 0.223930910 | 18,189.643480108 | 81,228.819723699 | 0 | 0 | 354,627 |
| VAP_ASIAN | 44,696 | 1.002659639 | 0.224508506 | 5,285.069231514 | 23,540.619141032 | 0 | 0 | 417,844 |
| VAP_HAWAII | 1,562 | 0.959718009 | 0.214893318 | 177.770217548 | 827.248699003 | 0 | 0 | 442,003 |
| VAP_INDIAN | 12,613 | 0.972455413 | 0.217745388 | 1,452.136389831 | 6,668.965089288 | 0 | 0 | 434,705 |
| VAP_MULTI | 30,359 | 0.989274905 | 0.221511490 | 3,547.981985029 | 16,017.146470689 | 0 | 0 | 424,591 |
| VAP_OTHER | 2,825 | 0.977274145 | 0.218824364 | 326.650993123 | 1,492.754218565 | 0 | 0 | 441,274 |
| TOTAL | 3,544,890 | 1 | 0.223912978 | 1,867,672.000000000 | 418,196.000000000 |
Splits
Aiken County
Richland County